

Barnhart Group, Inc Provides Corporate and Industry Update

NORTH EAST, PA, September 2, 2026 – Barnhart Group, Inc. (“Barnhart Group” or the “Company”), a growth oriented transportation services company specializing in the full-service logistics market, today provided a shareholder update covering the Company’s consolidated financial results through May 2026.
Barnhart Group is a family of transportation companies operating across asset-based truckload, freight brokerage, specialized heavy haul, international forwarding, fleet maintenance, and equipment leasing service lines. The Company’s current operating divisions include Barnhart Transportation, Barnhart Logistics, Barnhart Specialized, Barnhart Fleet Maintenance, Barnhart Driveaway, Barnhart Global, Route 20 Tank Wash, and Legend Equipment Leasing. Financial results presented herein reflect the May 2026 consolidated performance of all operating division on an intercompany-eliminated basis, excluding discontinued operations, and were not audited.
May 2026 – Consolidated Financial Results
May 2026 consolidated results reflect continued year-over-year revenue growth, with consolidated revenue increasing 10.8% versus May 2025. Consolidated gross profit and Adjusted Operating EBITDA were impacted in the month primarily by a significant non-recurring cost overrun within the Barnhart Specialized division, as described below. Management views this as an isolated divisional result and does not consider it representative of the Company’s ongoing consolidated operational performance.
Revenue
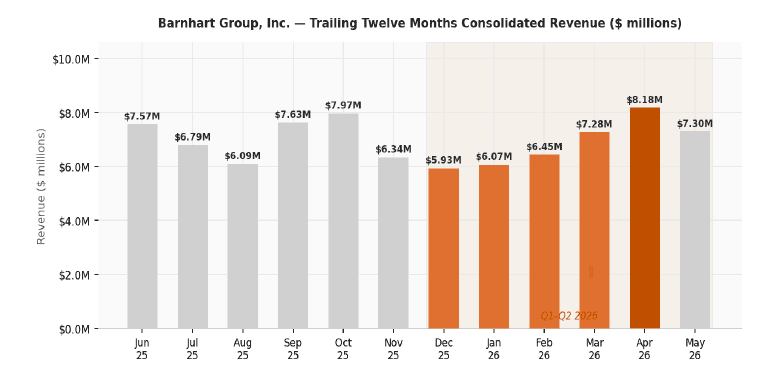
Total Consolidated Revenue – May 2026: $7.30 million, representing a 10.8% increase versus May 2025 ($6.59 million), reflecting continued year-over-year revenue growth across the Company’s operating divisions against an improved freight rate backdrop.
Year-to-Date Consolidated Revenue (January – May 2026): $35.3 million, an increase of 8.6% versus the same period in 2025 ($32.5 million).
Last Twelve Months (LTM) Consolidated Revenue: $83.6 million, compared to LTM revenue of $82.9 million for the same trailing twelve-month period ended May 2025, a year-over-year increase of 0.9%.
Gross Profit and Margin
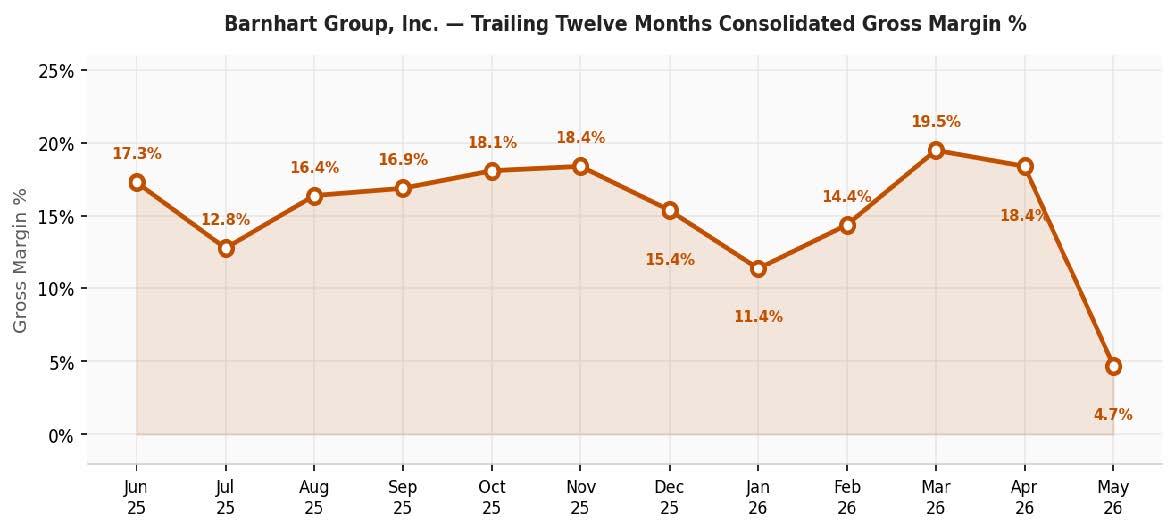
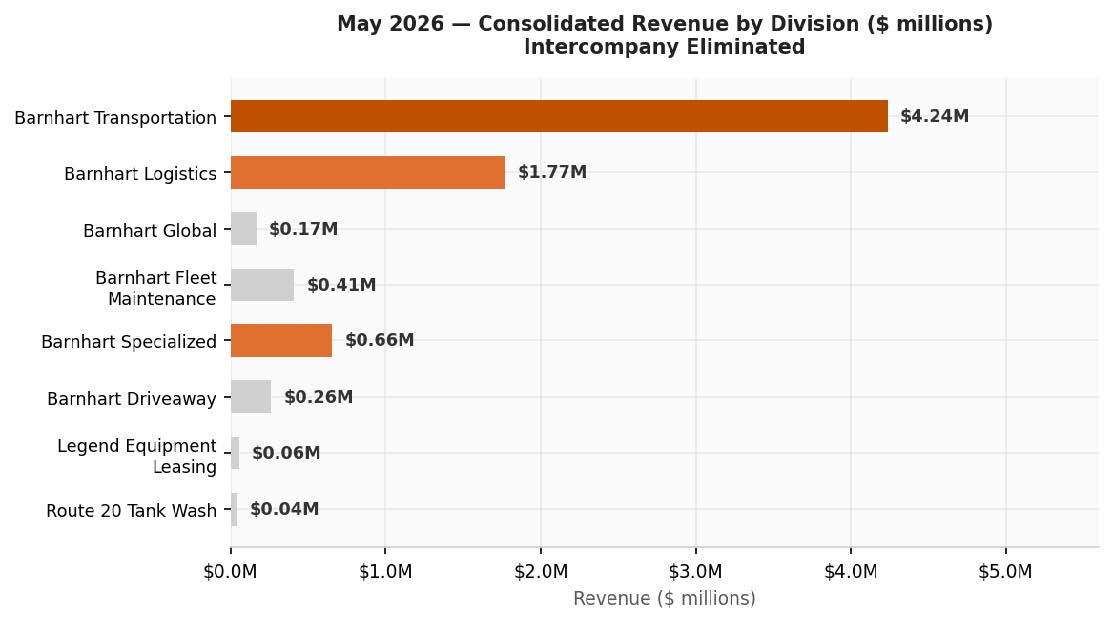
Consolidated Gross Profit – May 2026: $339,709, representing a gross margin of 4.7% on a consolidated basis. This result was materially impacted by Barnhart Specialized, which recorded a gross loss of ($493,468) on revenue of $655,541 in May 2026, a gross margin of (75.3%). The gross loss within Barnhart Specialized was driven by elevated cost of goods sold relative to revenue in the month, reflecting non-recurring charges and cost timing within the division. Excluding the Barnhart Specialized division result, the remaining consolidated operations generated gross profit of $833,177, representing a gross margin of approximately 12.5% on $6.64 million of revenue — consistent with the Company’s recent trend. Management currently expects the Barnhart Specialized division to return to normalized margin performance in subsequent periods.
Year-to-Date Consolidated Gross Profit (January – May 2026): $4.89 million at a YTD consolidated gross margin of 13.8%, compared to a gross margin of approximately 7.7% for the same period in 2025, reflecting the year-over-year improvement in the broader consolidated margin structure.
Last Twelve Months (LTM) Consolidated Gross Profit: $12.88 million at an LTM gross margin of 15.4%, compared to $13.39 million at a gross margin of 16.2% for the trailing twelve months ended May 2025. The year-over-year LTM GP comparison reflects the impact of the anomalous May 2026 result within the current LTM window; on a sequential basis, gross margins have recovered to the 18–19% range in the months surrounding May 2026.
Last Twelve Months (LTM) Consolidated Gross Profit: $12.88 million at an LTM gross margin of 15.4%, compared to $13.39 million at a gross margin of 16.2% for the trailing twelve months ended May 2025. The year-over-year LTM GP comparison reflects the impact of the anomalous May 2026 result within the current LTM window; on a sequential basis, gross margins have recovered to the 18–19% range in the months surrounding May 2026.
Adjusted Operating EBITDA
Consolidated Adjusted Operating EBITDA – May 2026: ($620,251), representing a margin of (8.5%). As described above, the Barnhart Specialized division was the primary driver of this result, with the division recording an Adjusted Operating EBITDA loss of ($649,211) in May 2026. The remaining consolidated operations generated positive Adjusted Operating EBITDA of $28,960 in May 2026, reflecting the continued positive underlying operational trend of the Company’s other divisions. In addition, the Company recorded $578,470 of non-recurring expense reclassifications in May 2026 — the largest monthly addback amount in the current reporting period — representing one-time and non-cash charges pulled out of cost of goods sold and operating expense and reclassified below the EBITDA line in accordance with the Company’s consistent accounting treatment.
Year-to-Date Adjusted Operating EBITDA (January – May 2026): $594,311 at a 1.7% margin. Management notes that the January through April 2026 YTD Adjusted Operating EBITDA was $1.21 million at a 4.3% margin, and that the May 2026 result reduced the cumulative YTD figure. Management notes that the YTD comparison is impacted by the anomalous May 2026 result discussed below, and that the underlying operating trend is meaningfully positive. Management expects the YTD profitability trajectory to recover as Barnhart Specialized returns to normalized performance.
Last Twelve Months (LTM) Consolidated Adjusted Operating EBITDA: $908,898 at an LTM margin of 1.1%, compared to $2,504,555 at a margin of 3.0% for the trailing twelve months ended May 2025. The year-over-year LTM EBITDA decline reflects two factors: the elevated LTM May-25 period captured stronger 2024 months prior to the freight market deterioration in H2 2025, and the current LTM window includes the anomalous May 2026 result. Management views the sequential monthly EBITDA trend — which improved from ($41,930) in January 2026 to $581,551 in April 2026 — as more reflective of the Company’s current operational trajectory.
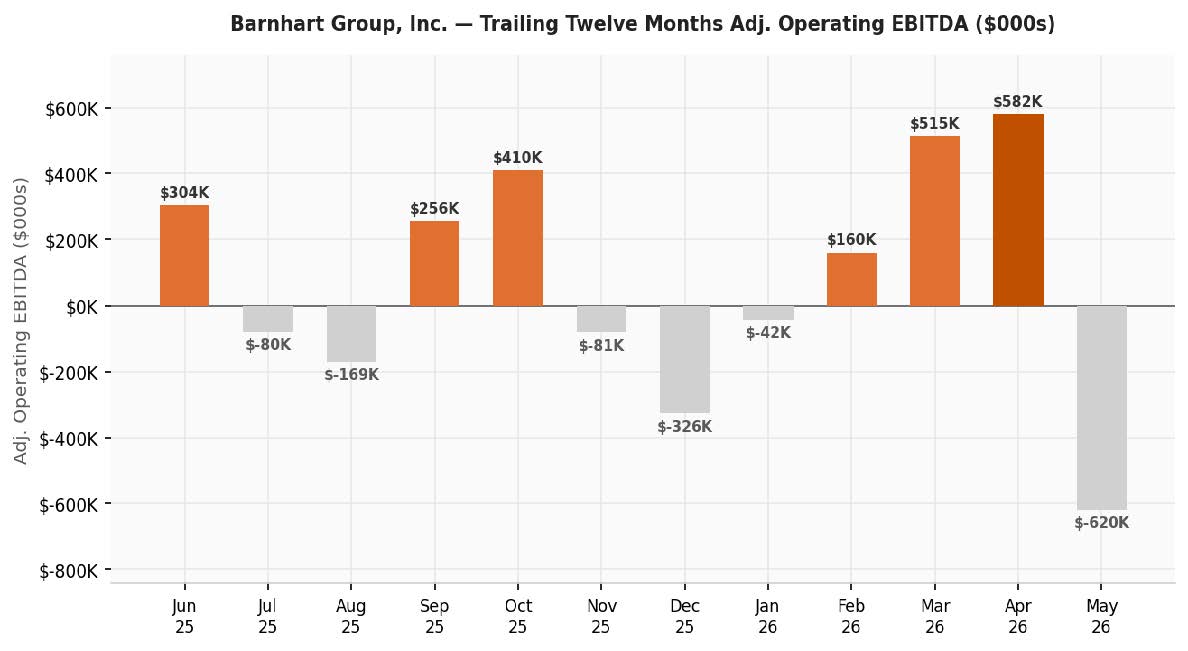
Note on May 2026: The TTM EBITDA chart reflects an Adjusted Operating EBITDA of ($620,251) for May 2026, which is anomalous relative to the surrounding months. This result was driven by non-recurring items reclassified below the line as expense adjustments and non-operating other income/expense items. Management views May 2026 as non-representative of the Company’s ongoing operational run-rate.
Consolidated Revenue by Operating Division – May 2026
The following table presents May 2026 and May 2025 revenue, gross profit, and gross margin by operating division. All figures are sourced directly from the Company’s consolidated financial statements and are presented on a pre-intercompany elimination, gross division basis consistent with the Company’s internal divisional reporting. Consolidated May 2025 revenue was $6,590,459 at a gross margin of 12.9%, compared to $7,299,458 at 4.7% in May 2026, with the consolidated year-over-year margin decline attributable primarily to the Barnhart Specialized result described above.
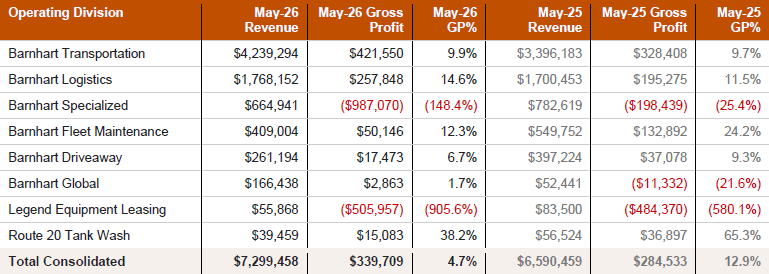
All division-level figures for both May 2026 and May 2025 are presented on a post-intercompany elimination, gross division basis sourced from the Company’s monthly consolidated financial statements. Consolidated totals reflect intercompany-eliminated figures. Legend Equipment Leasing’s negative gross profit in May 2025 reflects the accounting treatment of equipment depreciation classified within cost of goods sold, which is a non-cash item and is not indicative of an operational loss.
Freight Market Conditions
The DAT Load-to-Truck Ratio — an industry-standard metric measuring freight demand relative to available truck capacity — registered 71.57 in May 2026, essentially stable from 72.26 in April 2026 and near the March 2026 peak of 76.45. This sustained elevated reading reflects a freight market that remains materially tighter than the conditions experienced throughout 2023–2025, when the ratio was consistently in the 18–28 range.
The Company’s May 2026 financial package noted that the DAT ratio was expected to ease to the 55–65 range in June 2026. Despite this anticipated near-term moderation, management notes that even a ratio in the 55–65 range remains substantially above the multi-year lows experienced through 2025, and continues to represent a constructive rate environment for the Company’s asset-based divisions.
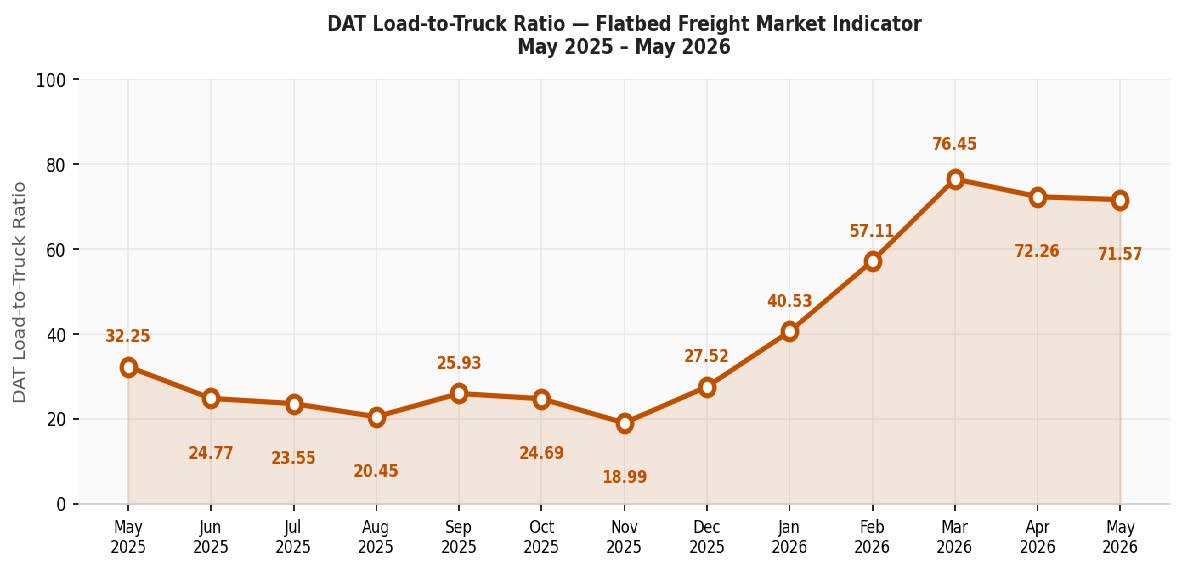
Source: DAT Freight & Analytics, Flatbed Load-to-Truck Ratio, May 2026. DAT Freight & Analytics is an independent third-party provider of freight market data and analytics. The Load-to-Truck Ratio represents the number of load postings per truck posting on the DAT network for a given period. The Company has no affiliation with DAT Freight & Analytics.
Industry Outlook and Market Conditions
The following compares May 2026 performance to May 2025 to illustrate the year-over-year change in market conditions and financial results:
• Consolidated revenue of $7.30 million in May 2026 compared to $6.59 million in May 2025, an increase of 10.8% year-over-year, reflecting continued volume growth across the Company’s operating divisions against an improved freight rate backdrop.
• Consolidated gross margin of 4.7% in May 2026 compared to 12.9% in May 2025. As described above, this decline is attributable primarily to the Barnhart Specialized divisional result in May 2026. Excluding Barnhart Specialized, the remaining consolidated operations delivered a gross margin of approximately 12.5% in May 2026, broadly in line with May 2025 levels. The Barnhart Specialized result is not considered by management to be indicative of deterioration in the Company’s underlying consolidated pricing or direct cost structure.
• The DAT Load-to-Truck Ratio of 71.57 in May 2026 compared to approximately 32.25 in May 2025 (the earliest data point in the Company’s current reporting window), reflecting a dramatically improved freight demand environment year-over-year that supports ongoing pricing improvement across the Company’s asset-based service lines.
• Continued federal and state infrastructure investment is driving sustained demand for specialized transportation services, benefiting Barnhart Specialized’s growing Texas platform and Barnhart Transportation’s heavy haul operations.
• Tariff-related uncertainty is creating some freight flow disruption in certain trade lanes; however, management believes Barnhart Group’s diversified geographic footprint and multi-modal service capabilities position the Company to benefit from resulting freight routing changes.
Management believes the freight market recovery evident throughout H1 2026 will continue to support above-prior-year revenue performance and, absent the non-recurring divisional items experienced in May 2026, above-prior-year profitability.
Cost Management and Operational Discipline
• Excluding the Barnhart Specialized division result, the Company’s core operational cost structure in May 2026 remains consistent with the positive trend established in Q1 2026:
• Total consolidated operating expense of $959,960 in May 2026 is modestly above the $925,301 reported in April 2026 and the $971,231 reported in May 2025, reflecting normal monthly variability and consistent with management’s targets for overhead.
• Days Sales Outstanding (DSO) was 43 days in May 2026, compared to 41 days in April 2026 and 44 days in May 2025, reflecting continued improvement in accounts receivable management relative to the prior year.
• Days Payables Outstanding (DPO) was 42 days in May 2026, compared to 38 days in April 2026 and 36 days in May 2025, reflecting normalized vendor payment practices.
Debt
Debt Reduction and Balance Sheet
The Company continued to make progress managing its debt profile through May 2026:
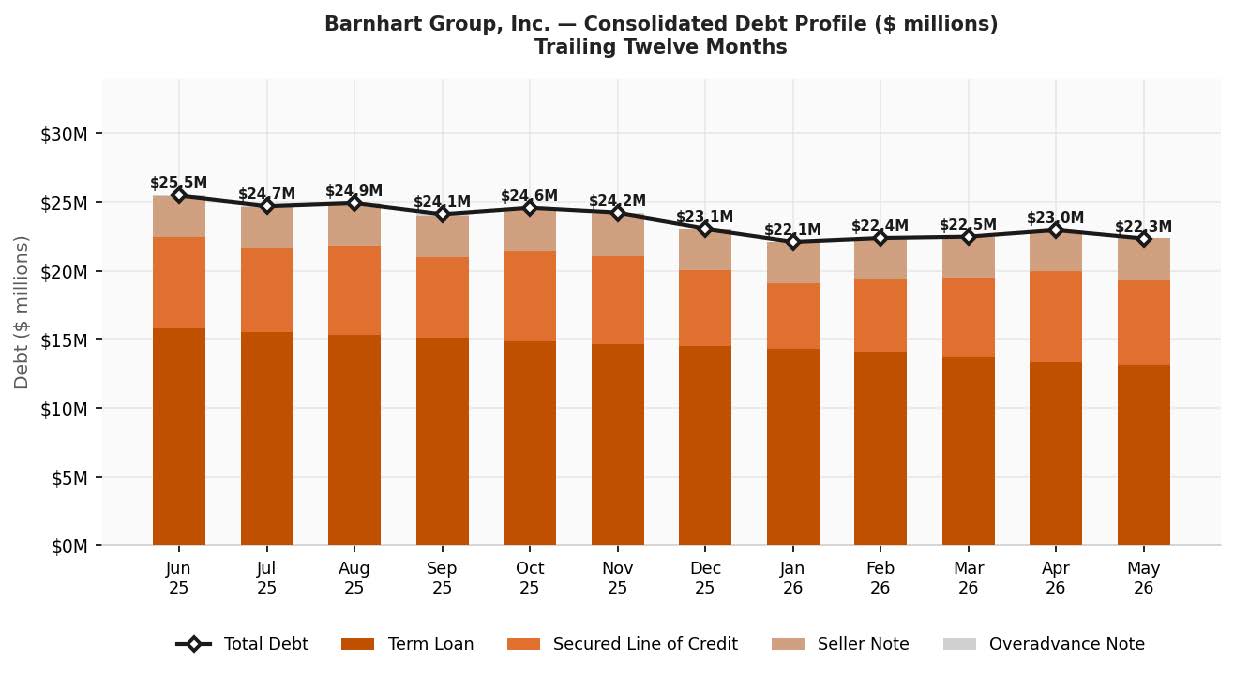
• GRC Term Loan: Outstanding principal reduced to $13.12 million as of May 31, 2026, down from $15.82 million in June 2025 — a reduction of $2.70 million over the trailing twelve-month period through continued scheduled amortization and strategic principal payments.
• Secured Line of Credit: $6.22 million outstanding within the $12 million revolving credit facility as of May 31, 2026.
• Seller Note: $3.00 million outstanding.
• Total Debt: $22.33 million as of May 31, 2026.
• Cash: $792,772 as of May 31, 2026, down from $916,847 at April 30, 2026.
Strategic Initiative Progress
“One Goal, One Team, One Vision”
The Company’s unifying strategic framework continues to drive collaboration and alignment:
• The Race to Ten initiative — targeting $10 million in monthly consolidated revenue — continued to drive team engagement, with YTD revenue of $35.3 million through May 2026, demonstrating sustained progress. The Company’s May 2026 result of $7.30 million demonstrates the platform’s capacity to approach this milestone.
• Six of eight operating divisions generated positive gross profit in May 2026, reflecting the broad-based health of the consolidated platform outside of the Barnhart Specialized item.
Barnhart Specialized – Texas Platform
Barnhart Specialized generated $655,541 in consolidated revenue in May 2026, with $4.07 million year-to-date through May 2026. As disclosed above, the division recorded an anomalous gross loss in May 2026 driven by non-recurring cost items. Management is monitoring this division’s performance closely and expects a return to positive margin contribution in subsequent periods. The division’s LTM revenue of $11.96 million reflects the meaningful scale this platform has achieved since its inception.
Technology and Operational Excellence
• Real-time performance metrics and digital displays remain fully deployed across all operational facilities.
• The Company continues to advance its internally-developed RPA and AI solutions program.
• The Company has continued to grow its customer base in 2026, building on the 237 new customers added since January 1, 2025, which collectively generated over 2,300 orders and approximately $4 million in revenue since January 1, 2025.
2026 Outlook
Based on the Company’s financial results through May 2026 and management’s current assessment of market conditions:
• Revenue Growth: YTD revenue of $35.3 million through May 2026 (+8.6% versus the prior year period) and the sustained elevated DAT Load-to-Truck Ratio support management’s expectation of continued organic revenue growth across all operating divisions through the remainder of 2026.
• Profitability: Management expects the non-recurring Barnhart Specialized cost items that impacted May 2026 to normalize in subsequent periods. The Company’s demonstrated ability to generate 18–19% consolidated gross margins in March and April 2026 supports management’s expectation of continued profitability improvement through H2 2026.
• Balance Sheet: The Company remains committed to continued reduction of the GRC Term Loan through operational cash generation. The $2.70 million reduction in term debt over the trailing twelve months through May 2026 reflects this commitment.
• Market Environment: The DAT flatbed load-to-truck ratio held in an elevated range through the spring — generally in the mid-60s to high-80s from March through May 2026 — before moderating steadily over the summer, falling through the 55–65 range in late June and continuing lower into the 30s by August. Taken alone, this decline reflects normal seasonal cooling and a real, near-term demand headwind: single-family housing starts fell nearly 10% in July, and industrial freight demand softened into late summer, both of which weigh directly on flatbed volumes. We view this as a demand pause to plan around rather than a structural reversal, consistent with building permits holding roughly flat over the same period.
More relevant to the outlook for asset-based carriers is that spot and contract rates have not given back the ground the ratio has: flatbed linehaul rates remained roughly 35–40% above year-ago levels through August and roughly 28–33% above the nine-year seasonal average, even as the ratio itself fell to a third of its spring peak. The current load-to-truck ratio is still up more than 70% year over year versus the same week in 2025, underscoring that capacity — not demand — remains the binding constraint. That capacity constraint is structural rather than cyclical: carrier bankruptcies, DOT enforcement actions, and CDL program decertifications have been removing capacity from the market independent of freight volumes, a dynamic industry analysts (ACT Research, among others) expect to persist through Q3’s seasonal lull and into year-end. On that basis, management continues to view freight market conditions as constructive for asset-based carriers through 2026 — supported by sustained rate strength and structural capacity attrition, even as the load-to-truck ratio itself normalizes off its spring highs.
Stockholder Value Creation
The Company’s board of directors and management remain committed to creating sustainable stockholder value through operational excellence and strategic growth initiatives. As previously communicated, the board continues to evaluate various options for enhancing stockholder liquidity, including:
• Re-listing on a national securities exchange
• Strategic partnerships or merger opportunities
• Private equity recapitalization
• Management buyout alternatives
These evaluations will continue as the Company’s financial performance and market conditions evolve throughout 2026. No assurances can be given that any particular transaction or liquidity event will occur.
Looking Forward
While May 2026 reported results were impacted by the Barnhart Specialized divisional item described above, the Company’s underlying consolidated platform continued to generate year-over-year revenue growth and positive operational performance across its other divisions against an improving freight market backdrop. Six of eight operating divisions generated positive gross profit in May 2026, and the Company’s diversified service lines, growing customer base, and disciplined cost structure remain intact. Management is confident in the Company’s ability to resume the profitability trajectory demonstrated in Q1 2026 as divisional results normalize.
Management is confident that the Company’s diversified platform, the sustained improvement in freight market conditions relative to 2023–2025, and an experienced leadership team and workforce position Barnhart Group for continued financial improvement and stockholder value creation through the remainder of 2026.
About Barnhart Group, Inc.
Barnhart Group, Inc. is a growth-oriented transportation services company specializing in the full-service logistics market. As a family of transportation companies, Barnhart Group offers comprehensive logistics solutions, serving as a single service provider for shipments of all sizes, both domestically and internationally. Additional information about Barnhart Group and its operating companies is available at www.barnhartinc.com.
Sincerely,
Bryan Barnhart
Chief Executive Officer, Barnhart Group, Inc.
Investor Contact: info@barnhartinc.com
Future Company updates and press releases will be made available on the Company’s website at www.barnhartinc.com under the “About Us” section. The next stockholder update is currently anticipated in fall 2026.
Forward-Looking Statements
This corporate update contains forward-looking statements within the meaning of Section 27A of the Securities Act of 1933, as amended, and Section 21E of the Securities Exchange Act of 1934, as amended. Forward-looking statements include, without limitation, statements regarding the Company’s expected future financial performance, revenue growth, margin improvement, debt reduction, market conditions, strategic initiatives, and stockholder value creation. These statements are based on management’s current expectations and assumptions and are subject to a number of known and unknown risks, uncertainties, and other factors that could cause actual results to differ materially from those expressed or implied by such forward-looking statements, including but not limited to: changes in freight market conditions and pricing; tariff, trade, and regulatory policy changes; the Company’s ability to execute on its growth strategy; competition in the transportation and logistics industry; changes in fuel prices and availability; the Company’s ability to attract and retain qualified drivers, employees, and owner-operators; changes in interest rates and credit market conditions; the Company’s ability to service its indebtedness; the outcome of any strategic alternatives evaluation process; and other factors. Forward-looking statements speak only as of the date of this update. The Company undertakes no obligation to update or revise any forward-looking statement, whether as a result of new information, future events, or otherwise, except as required by applicable law. Investors and stockholders are cautioned not to place undue reliance on forward-looking statements. Nothing in this update should be construed as a guarantee of future performance or as legal, financial, investment, or tax advice.