

Barnhart Group, Inc Provides Corporate and Industry Update

NORTH EAST, PA — October 7, 2026 Barnhart Group, Inc. (“Barnhart Group” or the “Company”), a growth-oriented transportation services company specializing in the full-service logistics market, today provided a shareholder update highlighting continued operational progress and financial performance through June 2026.
Barnhart Group is a family of transportation companies operating across asset-based truckload, freight brokerage, specialized heavy haul, international forwarding, fleet maintenance, and equipment leasing service lines. The Company’s current operating divisions include Barnhart Transportation, Barnhart Logistics, Barnhart Specialized, Barnhart Fleet Maintenance, Barnhart Driveaway, Barnhart Global, and Route 20 Tank Wash. Consolidated financial results presented herein reflect the performance of all operating divisions on an intercompany-eliminated basis, subject to management adjustments, exclude discontinued operations, and were not audited. Segment-level detail is presented on a standalone post-intercompany elimination consistent with the Company’s internal divisional reporting (see the note accompanying the segment table).
Executive Summary
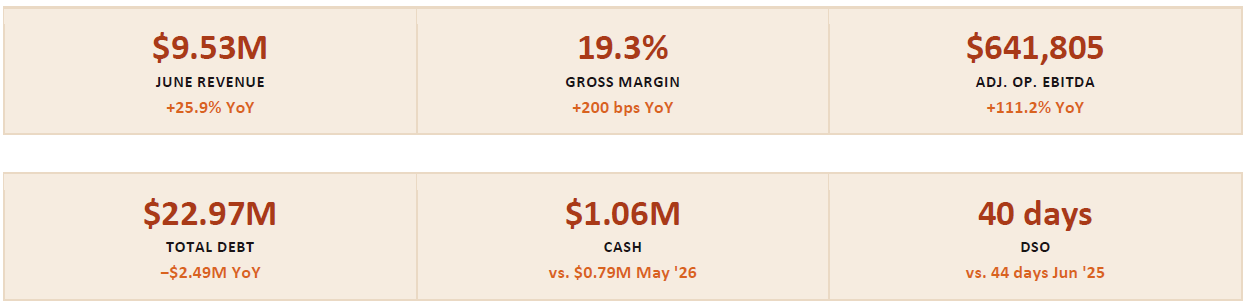
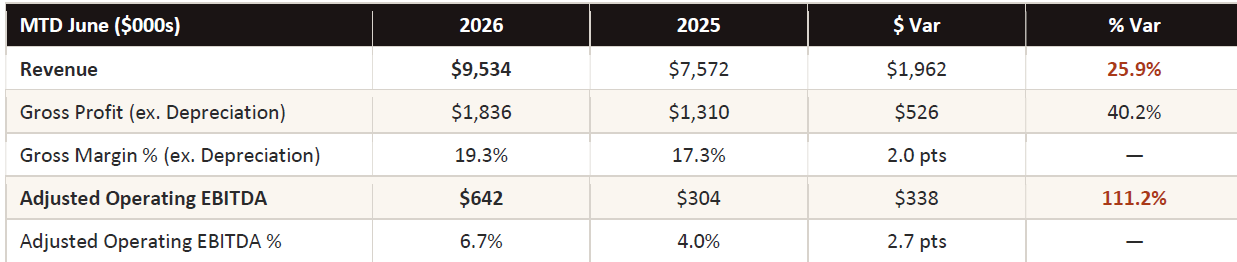
June 2026 was the strongest month since March 2025. Consolidated revenue surpassed $9.5 million, up 25.9% year-over-year, while gross margin expanded 200 basis points to 19.3% and Adjusted Operating EBITDA more than doubled to $641,805 — a 111.2% improvement over June 2025. The Company continued to strengthen its balance sheet, reducing Senior Secured Bank Term Loan principal by $3.16 million over the trailing twelve months, while building cash to $1.06 million. Growth was broadbased across the platform, freight market conditions remained meaningfully improved relative to 2025 and the previous three years of industry downturn. Management believes the combination of record revenue, improving margins, and a strengthening balance sheet positions the Company well for the remainder of 2026.
Revenue
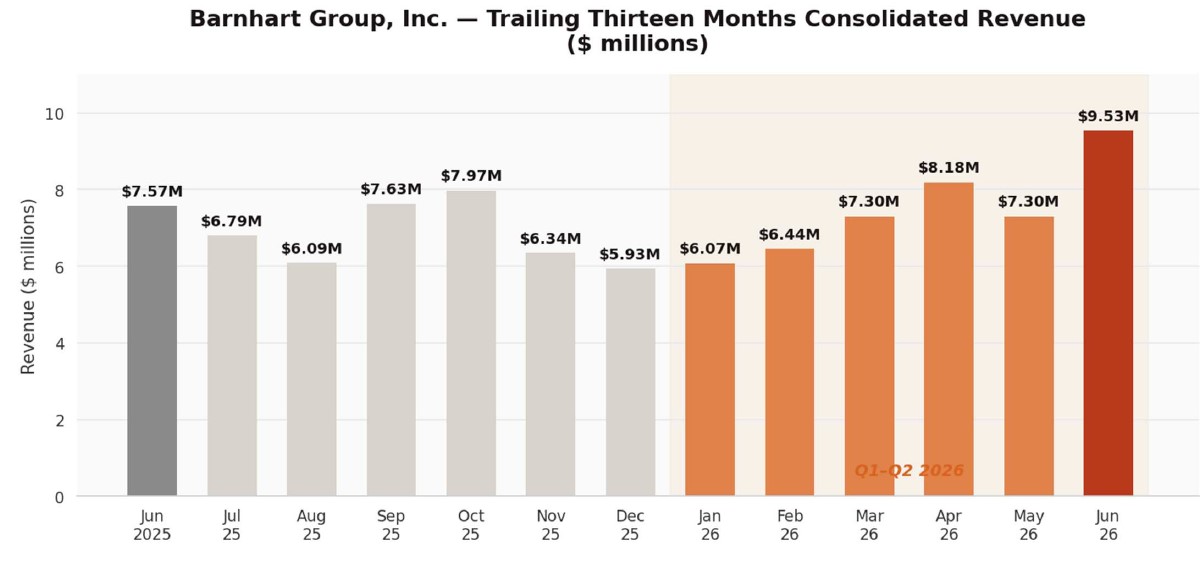
Barnhart Group delivered its strongest consolidated monthly revenue result on record in June 2026, surpassing $9.5 million for the first time in the Company’s current reporting structure. June’s results reflect continued execution of the Company’s
“One Goal, One Team, One Vision” strategic framework, broad-based growth across operating divisions, and the sustained benefit of an elevated freight rate environment.
 Year-to-Date Consolidated Revenue (Jan–Jun 2026): $44.8 million, an increase of 11.8% versus the same period in 2025 ($40.1 million).
Last Twelve Months (LTM) Consolidated Revenue — June 2026: $85.6 million, compared to LTM revenue of $74.3 million for the trailing twelve-month period ended June 2025, a year-over-year increase of 15.2%.
Gross Profit and Margin
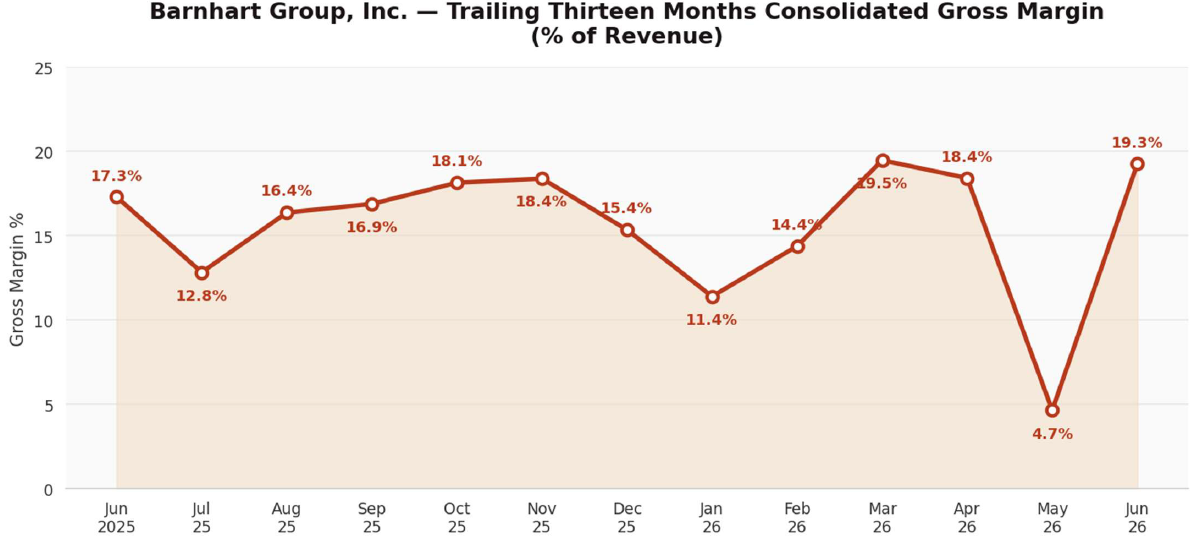
Consolidated Gross Profit and Margin — June 2026: $1.84 million, representing a gross margin of 19.3%, compared to $1.31 million and a gross margin of 17.3% in June 2025. The year-over-year improvement of $526,000 in gross profit dollars reflects both the benefit of higher revenue volume and a 200 basis point improvement in gross margin percentage, driven in part by the supply side market recovery that is creating higher pricing across the Company’s asset-based service lines.
Year-to-Date Consolidated Gross Profit and Margin (Jan–Jun 2026): $6.72 million at a YTD consolidated gross margin of 15.0%, compared to a gross margin of approximately 16.7% for the same period in 2025.
Last Twelve Months (LTM) Consolidated Gross Profit and Margin: $13.40 million at an LTM gross margin of 15.7%, compared to $13.21 million at a gross margin of 17.8% for the trailing twelve months ended June 2025. Management notes that consolidated gross margin has recovered meaningfully on a sequential monthly basis, reaching 19.3% in June 2026, and views the trailing twelve-month margin compression as a function of the May 2026 prior-period issue noted in our Shareholder and Public Update for the May 2026 period and discussed below rather than a trend.
Adjusted Operating EBITDA
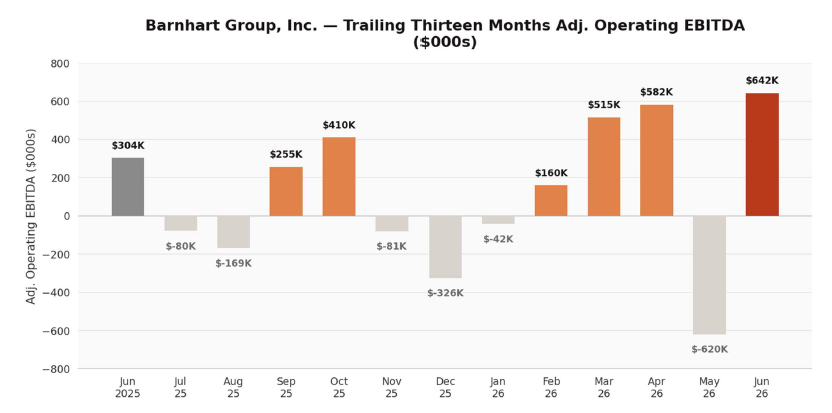
Consolidated Adjusted Operating EBITDA — June 2026: $641,805, representing a margin of 6.7%, compared to $303,898 and a 4.0% margin in June 2025 — a year-over-year improvement of $337,907, or 111.2%. This improvement reflects the combined benefit of $526,000 in additional gross profit dollars and management’s continued focus on operating expense discipline.
Year-to-Date Adjusted Operating EBITDA (Jan–Jun 2026): $1.24 million at a 2.8% margin, compared to $1.22 million at a 3.1% margin for the same period in 2025 — an increase of $11,540 year-over-year. Management notes that the YTD comparison is impacted by the anomalous May 2026 result noted in our Shareholder and Public Update for the May 2026 period and discussed below, and that the underlying operating trend is meaningfully positive.
Last Twelve Months (LTM) Consolidated Adjusted Operating EBITDA: $1.25 million at an LTM margin of 1.5%, compared to $2.57 million at a margin of 3.1% for the trailing twelve months ended June 2025. Management views the sequential monthly EBITDA trend — improving from ($41,930) in January 2026 to $641,805 in June 2026 — as more indicative of the Company’s current and improving operational trajectory than the LTM figure, which still carries the noise from the industry downturn and the anomalous May 2026 result.
NOTE ON MAY 2026
The TTM EBITDA chart reflects an Adjusted Operating EBITDA of ($620,251) in May 2026, which is anomalous relative to the surrounding months. This result was driven by non-recurring items reclassified below the line as expense adjustments and nonoperating
other income/expense items. Management views May 2026 as non-representative of the Company’s ongoing operational run-rate, as evidenced by the return to $641,805 in June 2026.
Cost Management and Operational Discipline
The Company’s cost management initiatives continued to yield positive results in June 2026:
- Consolidated gross margin of 19.3% in June 2026 is the highest consolidated monthly gross margin the Company has delivered since March of 2025, reflecting in part an improving pricing environment driven by contracting supply of
over the road trucks. - Total consolidated adjusted operating expense of $1,193,793 in June 2026 reflects increased activity-driven costs consistent with the Company’s record revenue month, but remains well-managed on a per-revenue-dollar basis
(12.5% of revenue) as the Company’s overhead structure continues to scale efficiently.
Debt Reduction
The Company continued to make progress managing its debt profile and liquidity position through June 2026:

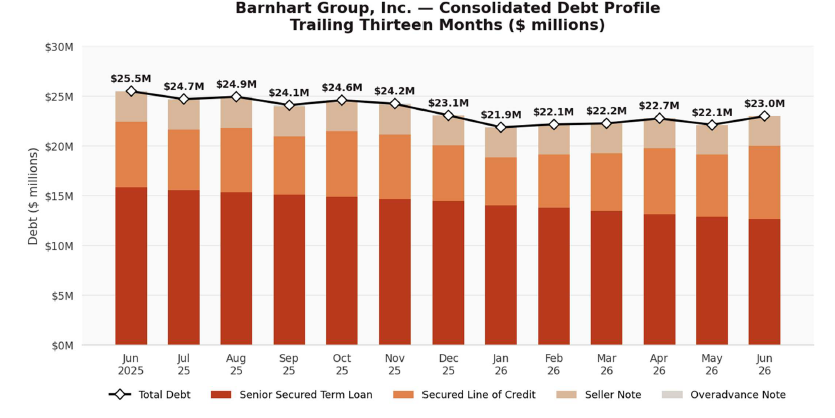
● Senior Secured Bank Term Loan: outstanding principal reduced to $12.66 million as of June 30, 2026, down from $15.82 million as of June 30, 2025 — a reduction of $3.16 million over the trailing twelve-month period through
continued scheduled amortization and strategic principal payments.
● Secured Line of Credit: $7.31 million outstanding within the $12 million revolving credit facility as of June 30, 2026, compared to $6.59 million a year earlier, reflecting the funding of the Company’s record revenue month and
associated working capital requirements.
● Seller Note: $3.00 million outstanding, consistent with $3.01 million a year earlier.
 Cash and Net Debt
- Cash: $1,058,398 as of June 30, 2026, up from $792,772 at May 31, 2026 and down from $1,442,492 at June 30, 2025.
- Net Debt: $21.91 million as of June 30, 2026 (Total Debt of $22.97 million less Cash of $1.06 million), an improvement
from a net debt position of approximately $24.02 million as of June 30, 2025 (Total Debt of $25.46 million less Cash of
$1.44 million) — a reduction of $2.11 million year-over-year.
Working Capital Efficiency
Receivables and payables management continued to improve through June 2026, contributing to a shorter overall cash conversion cycle:
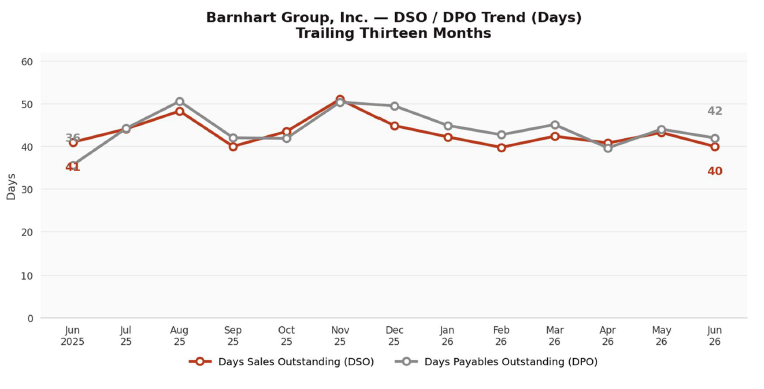
- Days Sales Outstanding (DSO): improved to 40 days in June 2026, compared to 41 days in June 2025, reflecting continued progress in accounts receivable management and collections efficiency.
- Days Payables Outstanding (DPO): 42 days in June 2026, compared to 36 days in June 2025. The extension in payment terms year-over-year reflects the Company’s management of vendor payment timing alongside its working
capital needs during a period of higher revenue volume.
Revenue by Operating Segment — June 2026
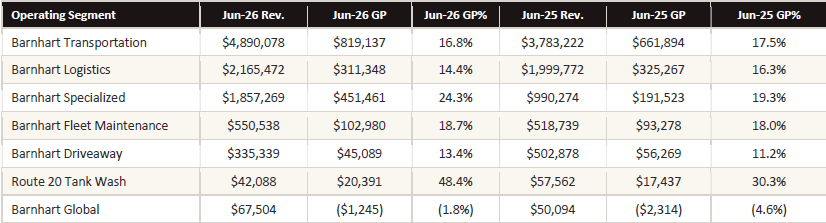
The following table presents June 2026 and June 2025 revenue, gross profit, and gross margin for the Company’s core operating segments, sourced directly from each segment’s standalone monthly income statement in the Company’s July 2026 consolidated financial reporting package, net of intercompany eliminations recorded within each segment’s own cost of goods sold. Legend Equipment Leasing, an immaterial non-operating leasing entity, is excluded from the table below.
Other Segment Highlights
● Barnhart Transportation remained the Company’s largest division by revenue at $4.89 million in June 2026 (+29.3% year-over-year), with continued strength in heavy-haul operations.
● Route 20 Tank Wash delivered a 48.4% gross margin in June 2026, up from 30.3% in June 2025, on revenue of $42,088.
● Broad-based divisional growth in June 2026, with seven of eight operating divisions delivering year-over-year revenue growth.
Freight Market Conditions
The DAT Load-to-Truck Ratio — an industry-standard metric measuring freight demand relative to available truck capacity — registered 59.37 in June 2026, compared to 71.57 in May 2026 and a peak of 76.45 in March 2026. While the ratio has
moderated from its Q1 2026 peak, it remains substantially elevated relative to the depressed readings throughout 2025, which ranged from a low of 18.99 in November 2025 to a high of 24.77 in June 2025. The full thirteen-month trend from June
2025 through June 2026 illustrates the decisive market recovery the Company has experienced over the period.
Subsequent to June 2026, the DAT Load-to-Truck Ratio moderated to the mid-to-upper 30s range in August 2026, reflecting normal seasonal softening, before recovering toward 41.84 for the week ending August 28, 2026 — roughly double the year ago level of approximately 21. Flatbed spot rates as of late August 2026 remained 32% above the same period in 2025 and approximately 27% above the nine-year seasonal average, reflecting the structural tightening of truck capacity relative to freight demand that has characterized the market throughout 2026. Truck capacity posted to the DAT network was down approximately 25–27% year over year through August 2026, while load posts remained up 25–35% year over year, sustaining the fundamental supply-demand imbalance that underlies the Company’s improved rate environment.
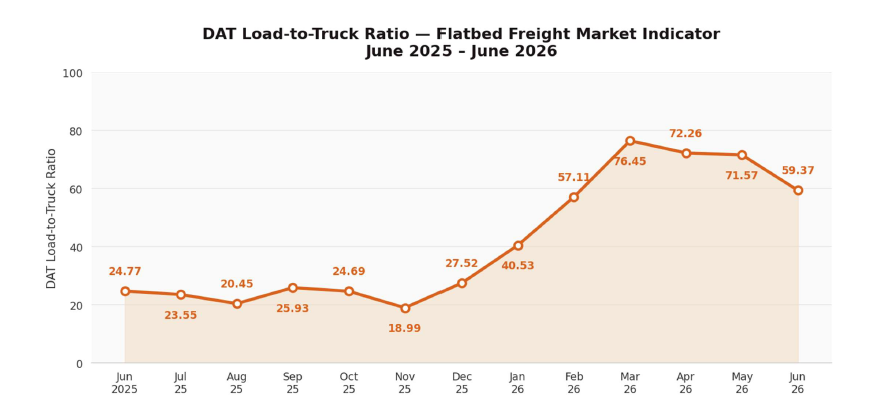
Source: DAT Freight & Analytics, Flatbed Load-to-Truck Ratio. DAT Freight & Analytics is an independent third-party provider of freight market data and analytics. The Load-to- Truck Ratio represents the number of load postings per truck posting on the DAT network for a given period. The Company has no affiliation with DAT Freight & Analytics.
Third-Party Market Indicators
Independent industry research corroborates the recovery reflected in the Company’s own results. RXO’s Q3 2026 truckload market forecast reports that linehaul spot rates rose 32.4% year-over-year in the second quarter of 2026, accelerating from 16.5% in the first quarter of 2026, while contract rates rose 6.0% year-over-year, up from 2.4% in the first quarter of 2026 — with spot rates holding above contract rates for a second consecutive quarter. RXO attributes much of the continued capacity tightening to federal enforcement actions affecting non-domiciled commercial driver’s licenses, which took effect in March 2026 and are estimated to remove roughly 200,000 drivers, or approximately 5% of active interstate CDL holders, from the market — which RXO characterizes as the most significant structural change to carrier supply since industry deregulation in 1980. RXO also notes that diesel prices have risen 54% since the start of 2026 and that the cost to operate a truck, excluding fuel, remains approximately 29% above the prior market peak in 2021, continuing to pressure carrier profitability even as rates improve.
Sources: RXO, “Q3 2026 Truckload Market Forecast: Spot & Contract Rate Trends,” rxo.com/resources/research/us-truckload-market-guide (accessed September 2026); Cass, Information Systems, “Cass Transportation Index Report, August 2026,” cassinfo.com/freight-audit-payment/cass-transportation-indexes/august-2026. Neither RXO nor Cass Information Systems is affiliated with the Company.
Management believes continued federal and state infrastructure investment is driving demand for specialized transportation services, directly benefiting Barnhart Specialized and Barnhart Transportation’s heavy haul operations. Management believes
the freight market environment through H1 2026, combined with the Company’s expanded revenue base and improved cost structure, supports continued improvement in cash generation and profitability through the remainder of 2026.
Strategic Initiative Progress
“One Goal, One Team, One Vision”
● The Race to Ten initiative — targeting $10 million in monthly consolidated revenue — saw June 2026’s $9.53 million consolidated result represent the closest the Company has come to this milestone to date, and management believes the $10 million threshold is within reach as freight market conditions to show strength.
Technology and Operational Excellence
● Real-time performance metrics and digital displays remain fully deployed across all operational facilities.
● The Company continues to advance its internally-developed RPA and AI solutions program, targeting efficiency improvements in dispatch, billing, and carrier management workflows. 2026
2026 Outlook
Based on the Company’s financial results through June 2026 and management’s current assessment of the freight market environment, management provides the following forward-looking commentary:
● Revenue Growth: June 2026’s record consolidated revenue of $9.53 million and YTD revenue of $44.8 million (+11.8% versus the prior year) support management’s expectation of continued organic revenue growth across all operating divisions through the remainder of 2026. Management anticipates that the Company will continue to benefit from the constrained supply given industry regulation and tightening.
● Profitability: June 2026’s gross margin of 19.3% and Adjusted Operating EBITDA margin of 6.7% — both representing year-over-year improvements — support management’s expectation of continued profitability improvement through the remainder of 2026.
● Balance Sheet: The Company remains committed to continued reduction of the Senior Secured Bank Term Loan through operational cash generation. The $3.16 million reduction in term loan principal over the trailing twelve months through June 2026 reflects this commitment, and management expects continued progress through the remainder of 2026.
● Market Environment: While the DAT Load-to-Truck Ratio moderated to the mid-30s range through August and into early September 2026, consistent with normal seasonal patterns following the Q1 2026 peak, it has since stabilized around 36.44 as of the week ending September 4, 2026 — substantially above 22.18 a year ago. As of the week ending September 4, 2026, load posts ran 46.2% above year-ago levels while truck posts remained 11.0% below year ago levels, with flatbed spot linehaul rates of $2.66 per mile running approximately 31% above year-ago levels and holding 27% above the nine-year seasonal average. The DAT iQ 35-day rate forecast projects flatbed spot linehaul at $2.63 per mile in mid-October 2026, approximately $0.57 per mile above year-ago levels at the same date. Management believes these market conditions continue to represent a materially improved operating environment for the Company’s asset-based carriers and support continued above-prior-year revenue and margin performance through H2 2026.
Stockholder Value Creation
The Company’s board of directors and management remain committed to creating sustainable stockholder value through operational excellence and strategic growth initiatives. As previously communicated, the board continues to evaluate various options for enhancing stockholder liquidity, including:
● Re-listing on a national securities exchange
● Strategic partnerships or merger opportunities
● Private equity recapitalization
● Management buyout alternatives
These evaluations will continue as the Company’s financial performance and market conditions evolve throughout 2026. No assurances can be given that any particular transaction or liquidity event will occur.
Looking Forward
Barnhart Group enters the second half of 2026 having delivered its strongest consolidated monthly revenue result in 14- months. The combination of record revenue, improved gross margins, and significantly higher year-over-year EBITDA in June 2026 demonstrates the strength of the Company’s platform and the effectiveness of the strategic and operational initiatives implemented since 2023. While management anticipates some near-term moderation in the freight rate environment, the Company’s diversified platform, expanded customer base, disciplined cost structure, and strengthening balance sheet position Barnhart Group to continue delivering above-prior-year performance through H2 2026.
Management is confident that the combination of the Company’s diversified platform, the sustained improvement in freight market conditions relative to 2023–2025, and our experienced leadership team and workforce positions Barnhart Group for continued financial improvement and stockholder value creation.
About Barnhart Group, Inc.
Barnhart Group, Inc. is a growth-oriented transportation services company specializing in the full-service logistics market. As a family of transportation companies, Barnhart Group offers comprehensive logistics solutions, serving as a single service
provider for shipments of all sizes, both domestically and internationally. Additional information about Barnhart Group and its operating companies is available at www.barnhartinc.com.
Sincerely,
Bryan Barnhart
Chief Executive Officer, Barnhart Group, Inc
Investor Contact: info@barnhartinc.com
Future Company updates and press releases will be made available on the Company’s website at www.barnhartinc.com under the “About Us” section. The next stockholder update is currently anticipated in fall 2026.
Forward Looking Statements
This corporate update contains forward-looking statements within the meaning of Section 27A of the Securities Act of 1933, as amended, and Section 21E of the Securities Exchange Act of 1934, as amended. Forward-looking statements include, without limitation, statements regarding the Company’s expected future financial performance, revenue growth, margin improvement, debt reduction, market conditions, strategic initiatives, and stockholder value creation. These statements are based on management’s current expectations and assumptions and are subject to a number of known and unknown risks, uncertainties, and other factors that could cause actual results to differ materially from those expressed or implied by such forward-looking statements, including but not limited to: changes in freight market conditions and pricing; tariff, trade, and regulatory policy changes; the Company’s ability to execute on its growth strategy; competition in the transportation and logistics industry; changes in fuel prices and availability; the Company’s ability to attract and retain qualified drivers, employees, and owner-operators; changes in interest rates and credit
market conditions; the Company’s ability to service its indebtedness; the outcome of any strategic alternatives evaluation process; and other factors. Forward-looking statements speak only as of the date of this update. The Company undertakes no obligation to update or revise any forward-looking statement, whether as a result of new information, future events, or otherwise, except as required by applicable law. Investors and stockholders are cautioned not to place undue reliance on forward looking statements. Nothing in this update should be construed as a guarantee of future performance or as legal, financial, investment, or tax advice.